
On this page0% through guide
Natural Selection
Evolution explains population change through inheritance, variation, and differential reproduction.
What you’ll learn
- Distinguish selection, drift, gene flow, and mutation.
- Use Hardy–Weinberg calculations with explicit assumptions.
- Interpret evidence for common ancestry and speciation.
Before you begin
Individuals survive and reproduce; populations evolve when their allele frequencies change across generations. Fitness is reproductive contribution relative to other individuals in a particular environment. A trait is useful evidence for natural selection only when variation is heritable and affects reproductive outcomes.
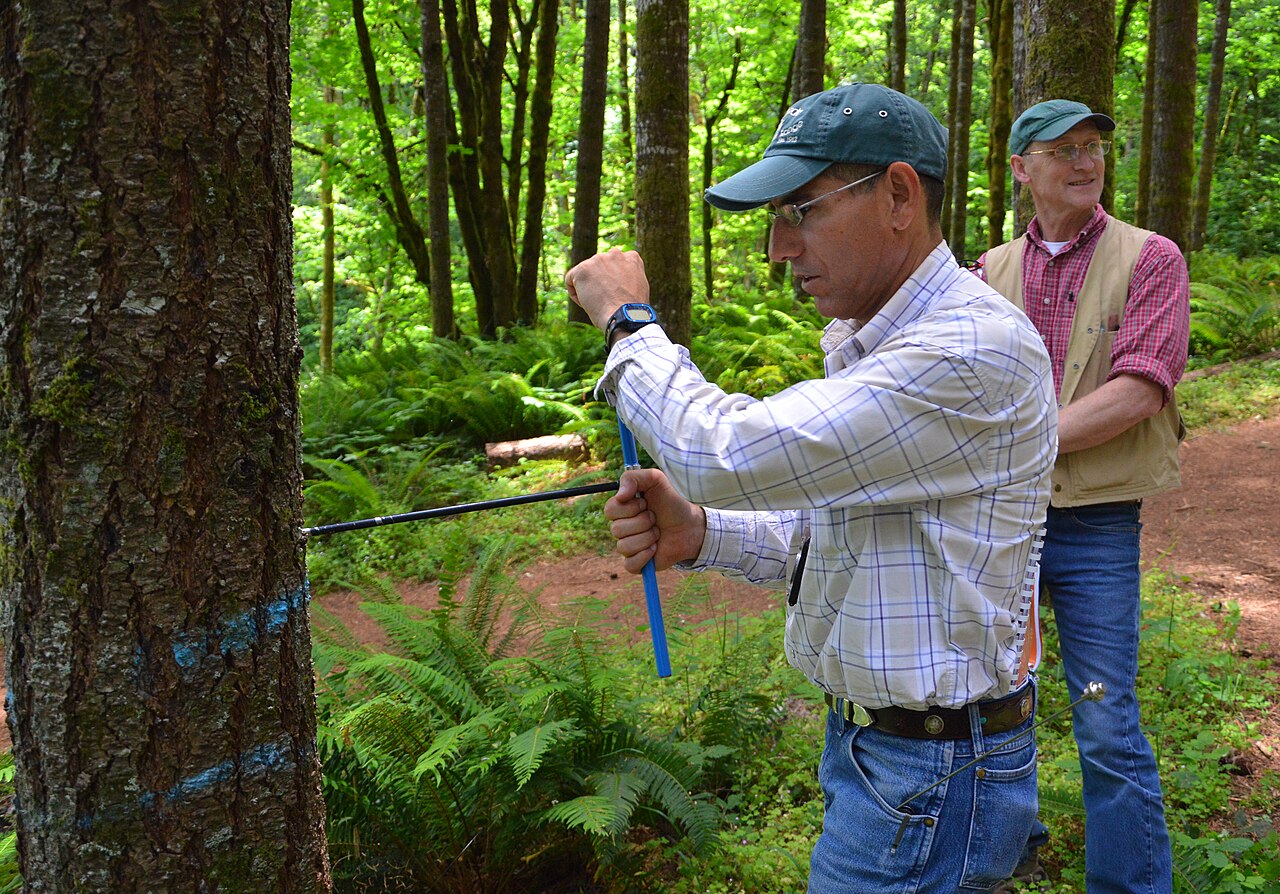
Field observations need a sampling frame, consistent measurements, and independent sampling units. Accessible locations alone can misrepresent the forest. This photograph illustrates fieldwork rather than supplying the numerical examples in this guide.
Photo: NRCS Oregon / USDA · Source · U.S. federal government public domain · Unmodified.Explain these starting ideas in your own words. Revisit them whenever a later step feels unclear.
Selection acts on existing heritable variation
A population contains variation, some of which is heritable. In a particular environment, individuals with some phenotypes contribute more surviving offspring than others. Across generations, alleles associated with those phenotypes can increase in frequency. Fitness refers to reproductive contribution in context, not physical strength or survival alone.
Individuals do not evolve a needed inherited trait during their lifetimes. Mutations arise without anticipating what the environment will demand. A treatment can select resistant variants already present or arising by mutation; it does not intentionally instruct organisms to make the useful mutation.
PAUSE & TRY IT
Can selection occur without producing evolution at a particular locus?
Reveal answer
Differential survival alone need not change allele frequencies if the relevant variation is not heritable or reproductive contributions do not differ.
Several processes change allele frequencies
Natural selection is nonrandom differential reproductive success. Genetic drift is change due to random sampling of alleles, with especially strong effects in small populations. Bottlenecks and founder events can reduce genetic diversity through drift, even when surviving individuals are not better adapted.
Gene flow moves alleles between populations through migration and reproduction. Mutation introduces new alleles. Nonrandom mating can change genotype frequencies; depending on the mechanism and its association with differential reproduction, it may also influence evolutionary change. Distinguish a change in heterozygosity from a demonstrated change in allele frequencies.
Read figure values as text
AA: p²: 0: 0; 0.025: 0.0006250000000000001; 0.05: 0.0025000000000000005; 0.075: 0.005625; 0.1: 0.010000000000000002; 0.125: 0.015625; 0.15: 0.0225; 0.175: 0.030624999999999996; 0.2: 0.04000000000000001; 0.225: 0.050625; 0.25: 0.0625; 0.275: 0.07562500000000001; 0.3: 0.09; 0.325: 0.10562500000000001; 0.35: 0.12249999999999998; 0.375: 0.140625; 0.4: 0.16000000000000003; 0.425: 0.18062499999999998; 0.45: 0.2025; 0.475: 0.225625; 0.5: 0.25; 0.525: 0.275625; 0.55: 0.30250000000000005; 0.575: 0.33062499999999995; 0.6: 0.36; 0.625: 0.390625; 0.65: 0.42250000000000004; 0.675: 0.45562500000000006; 0.7: 0.48999999999999994; 0.725: 0.525625; 0.75: 0.5625; 0.775: 0.6006250000000001; 0.8: 0.6400000000000001; 0.825: 0.6806249999999999; 0.85: 0.7224999999999999; 0.875: 0.765625; 0.9: 0.81; 0.925: 0.8556250000000001; 0.95: 0.9025; 0.975: 0.9506249999999999; 1: 1 • Aa: 2p(1−p): 0: 0; 0.025: 0.04875; 0.05: 0.095; 0.075: 0.13875; 0.1: 0.18000000000000002; 0.125: 0.21875; 0.15: 0.255; 0.175: 0.28874999999999995; 0.2: 0.32000000000000006; 0.225: 0.34875; 0.25: 0.375; 0.275: 0.39875; 0.3: 0.42; 0.325: 0.43875000000000003; 0.35: 0.45499999999999996; 0.375: 0.46875; 0.4: 0.48; 0.425: 0.48874999999999996; 0.45: 0.49500000000000005; 0.475: 0.49874999999999997; 0.5: 0.5; 0.525: 0.49874999999999997; 0.55: 0.495; 0.575: 0.48875; 0.6: 0.48; 0.625: 0.46875; 0.65: 0.45499999999999996; 0.675: 0.43875; 0.7: 0.42000000000000004; 0.725: 0.39875; 0.75: 0.375; 0.775: 0.34874999999999995; 0.8: 0.31999999999999995; 0.825: 0.28875000000000006; 0.85: 0.255; 0.875: 0.21875; 0.9: 0.17999999999999997; 0.925: 0.13874999999999993; 0.95: 0.09500000000000008; 0.975: 0.04875000000000004; 1: 0 • aa: (1−p)²: 0: 1; 0.025: 0.9506249999999999; 0.05: 0.9025; 0.075: 0.8556250000000001; 0.1: 0.81; 0.125: 0.765625; 0.15: 0.7224999999999999; 0.175: 0.6806249999999999; 0.2: 0.6400000000000001; 0.225: 0.6006250000000001; 0.25: 0.5625; 0.275: 0.525625; 0.3: 0.48999999999999994; 0.325: 0.45562500000000006; 0.35: 0.42250000000000004; 0.375: 0.390625; 0.4: 0.36; 0.425: 0.33062499999999995; 0.45: 0.30250000000000005; 0.475: 0.275625; 0.5: 0.25; 0.525: 0.225625; 0.55: 0.20249999999999996; 0.575: 0.18062500000000004; 0.6: 0.16000000000000003; 0.625: 0.140625; 0.65: 0.12249999999999998; 0.675: 0.10562499999999997; 0.7: 0.09000000000000002; 0.725: 0.07562500000000001; 0.75: 0.0625; 0.775: 0.05062499999999999; 0.8: 0.03999999999999998; 0.825: 0.030625000000000017; 0.85: 0.022500000000000006; 0.875: 0.015625; 0.9: 0.009999999999999995; 0.925: 0.005624999999999994; 0.95: 0.0025000000000000044; 0.975: 0.0006250000000000011; 1: 0
PAUSE & TRY IT
Why is drift stronger in a small population?
Reveal answer
Each sampled reproductive event represents a larger fraction of the gene pool, increasing random proportional changes.
Hardy–Weinberg is a comparison model
For a two-allele locus, allele frequencies sum to one. Under the Hardy–Weinberg model, expected genotype frequencies are p2, 2pq, and q2. The model assumes a sufficiently large population, random mating, and no selection, migration, or mutation affecting the locus. It provides a baseline against which data can be compared.
If a recessive phenotype reliably identifies aa and equilibrium assumptions apply, its frequency estimates q2, not q. A dominant phenotype combines AA and Aa and cannot be used directly as p2. If assumptions are not justified, observed genotype counts are preferable for calculating allele frequencies.
Evidence for ancestry is comparative
Shared homologous structures and conserved molecular sequences can support common ancestry. Similar function alone is less decisive because convergent evolution can produce analogous traits in separate lineages. Fossils, biogeography, morphology, and sequence comparisons provide complementary lines of evidence.
On a phylogenetic tree, relatedness depends on the most recent shared ancestor, not how close tips appear on the page. Rotating branches at a node does not change relationships. Modern species at the tips are not automatically ancestors of one another. A shared derived character helps identify a clade when its evolutionary history is appropriately inferred.
Speciation requires reduced gene exchange
Geographic separation can reduce gene flow and permit divergence through selection and drift. Reproductive barriers can act before fertilization or reduce hybrid viability or fertility afterward. Speciation can also occur without geographic separation in some circumstances, such as polyploidy in plants.
Environmental change can alter which variants have higher fitness and can increase extinction risk if populations cannot persist or shift. Evolution has no universal destination or ladder of progress. A trait can involve trade-offs: an advantage in one environment or life stage may impose a cost in another.
PAUSE & TRY IT
What evidence would support a prezygotic barrier?
Reveal answer
A difference such as mating time, behavior, or gamete compatibility that prevents fertilization between populations.
Separate selection from a purposeful story
A population contains variation before an environmental challenge. If a heritable variant improves reproductive success under that challenge, descendants carrying it can become more common. The environment does not instruct organisms to make the needed mutation. In antibiotic resistance, resistant variants may already exist or arise by mutation; exposure changes their relative success. An individual cell’s survival is not itself population evolution.
A complete natural-selection explanation identifies the initial variation, its heritability, the environmental pressure, and differential reproduction across generations. Avoid saying a population became “more advanced.” A trait advantageous in one environment can be costly in another. Stabilizing, directional, and disruptive selection describe patterns in phenotype distributions, but the pattern alone does not identify the underlying genes.
PAUSE & TRY IT
Why might an advantageous allele disappear from a very small population?
Reveal answer
Random sampling through drift can remove an allele despite its potential selective advantage.
Compare chance, movement, and nonrandom reproduction
Genetic drift is random change in allele frequencies due to sampling, especially influential in small populations. A bottleneck reduces population size sharply; a founder effect occurs when a small subset establishes a new population. Neither process requires the retained alleles to be better adapted. Gene flow moves alleles between populations and can reduce differences or introduce new variants.
Hardy–Weinberg equilibrium provides expected genotype frequencies from allele frequencies under simplifying assumptions. If p and q describe two alleles, p+q=1 and expected frequencies are p2, 2pq, and q2. A departure can suggest that assumptions are not met, but it does not uniquely identify selection. Mutation, migration, drift, and nonrandom mating can have different effects; nonrandom mating can change genotype frequencies even without an immediate allele-frequency change.
Read figure values as text
Population A: 0: 0.5; 1: 0.6; 2: 0.7; 3: 0.6; 4: 0.8; 5: 0.9 • Population B: 0: 0.5; 1: 0.4; 2: 0.5; 3: 0.3; 4: 0.2; 5: 0.1
PAUSE & TRY IT
Does rotating branches around a phylogenetic node change which organisms share the most recent ancestor?
Reveal answer
No. The branching connections remain the same.
Read phylogenies by common ancestry
A branch point represents a shared ancestor, and the order of branch points represents relationships. Rotating branches around a node does not change the relationships. Two species drawn next to one another are not necessarily each other’s closest relatives. Trace backward to the most recent common ancestor and compare it with the ancestors shared by other pairs.
Shared derived characters can support a clade, but superficially similar features can evolve independently through convergence. Molecular comparisons add evidence, and multiple independent lines of evidence strengthen an inference. Speciation requires reduced gene exchange and reproductive isolation; geographic separation can promote this but is not itself proof that speciation is complete. Extinction removes branches, so living species are not a ladder of stages leading toward a modern “highest” species.
Build a complete natural-selection explanation
Begin with variation among individuals before the selective event. Some of that variation must be heritable for differential reproduction to predict genetic change across generations. Connect a trait to survival or reproduction under a particular environmental condition, then explain unequal transmission of alleles. Survival alone is not enough if the survivors do not reproduce. Fitness is relative reproductive contribution in that environment, not strength, health or lifespan in isolation.
A treatment does not generally produce exactly the mutation that an organism needs. Resistant variants can already exist or arise without regard to their usefulness; selection changes their frequency. The same trait may be beneficial in one environment and costly in another. In the absence of a drug, for example, a resistance-associated cost can change the relative reproductive success of the variants.
Separate adaptation from acclimation. An individual may change physiology during its lifetime without a population’s allele frequencies changing. To support evolutionary change, look for heritable differences and changes across generations. A graph of body size over a few days could reflect growth, age structure, plasticity or selective loss; identify what was actually measured.
Keep evolutionary mechanisms distinct
Natural selection is nonrandom differential reproductive success associated with heritable variation. Genetic drift is chance sampling of alleles between generations and has especially strong effects in small populations. A bottleneck reduces a population abruptly; the surviving allele sample can differ from the original. A founder event starts a population from a small subset. Population size may later recover without restoring alleles that were lost.
Gene flow moves alleles between populations through successful migration and reproduction. Mutation creates new sequence variants. Nonrandom mating can alter genotype frequencies without necessarily changing allele frequencies immediately. These mechanisms can act together. Do not assign every observed change to selection simply because a frequency changed.
A strong experimental comparison distinguishes the mechanisms. If many replicate small populations diverge in different directions under similar conditions, chance sampling is plausible. If a heritable variant consistently increases under a particular condition and has measured reproductive advantages there, selection gains support. Neither description eliminates all possible confounding without a suitable design.
PAUSE & TRY IT
After a random storm, a rare allele disappears from a small island population. Does disappearance establish that the allele was harmful?
Reveal answer
No. Random survival can remove an allele through drift. Evidence of heritable differences in reproductive success is needed to support a selective explanation.
Use Hardy–Weinberg as a null model, not a definition of life
For two alleles, p+q=1 describes their frequencies. Under the model’s random-mating assumptions, expected genotype frequencies are p2, 2pq and q2. Stable allele frequencies across generations require additional conditions such as negligible selection, mutation, migration and drift. State which relationship you are using; the fact that allele frequencies sum to one does not prove equilibrium.
A recessive phenotype frequency equals q2 only under the relevant inheritance and equilibrium assumptions. Taking its square root gives q, an allele frequency, not the heterozygote frequency. Calculate 2pq separately. When genotype counts are given, count alleles directly: each homozygote contributes two copies of its allele and each heterozygote contributes one.
A deviation from expected genotype frequencies indicates that the stated model may be inadequate, but not which assumption failed. Inbreeding, population mixture, selection or sampling variation can produce different patterns. Explain the evidence and its limits rather than treating Hardy–Weinberg as a test that labels a population “evolving” for one uniquely identified reason.
Interpret common ancestry and speciation carefully
A phylogenetic tree represents hypotheses about branching ancestry. Relatedness is determined by the most recent common ancestor, not by physical distance between tips. Rotating branches around a node preserves the relationships. Unless a scale is supplied, branch length is not a measure of time or amount of change. Modern species at neighboring tips are not automatically ancestors of one another.
Homologous features are inherited from common ancestry; analogous similarities can evolve independently under similar selection. Molecular and structural evidence can be combined, and a shared derived character can support a clade. A highly similar functional shape alone may reflect convergence, so identify why a character is informative in the comparison.
Speciation involves reduced gene flow as reproductive barriers accumulate or arise. Prezygotic barriers reduce mating or fertilization; postzygotic barriers affect hybrid survival or fertility. Geographic separation can enable divergence, but geographic distance alone does not demonstrate persistent reproductive isolation. Evidence on renewed contact helps distinguish temporary separation from a lasting barrier.
FROM IDEA TO APPLICATION
Worked examples
Infer an allele frequency carefully
In a population consistent with Hardy–Weinberg assumptions, 9% of individuals show a fully penetrant recessive phenotype. Estimate the heterozygote frequency.
Reveal worked solution
- q2 = 0.09, so q = 0.30.
- p = 1 − 0.30 = 0.70.
- 2pq = 2(0.70)(0.30) = 0.42.
42% are expected to be heterozygous under the stated model.
Separate survival from evolutionary evidence
After a storm, a random subset of a small island population survives. One allele becomes more frequent, but survival is unrelated to genotype. Identify the mechanism.
Reveal worked solution
- The survivors are a chance sample of the previous population.
- No genotype-dependent reproductive advantage is described.
- The small surviving population can have altered frequencies through sampling.
Genetic drift associated with a population bottleneck, not demonstrated natural selection.
Recover allele frequencies from a recessive phenotype
In a large population consistent with Hardy–Weinberg assumptions, 9% express a recessive phenotype. Estimate the heterozygote frequency.
Reveal worked solution
- The recessive genotype frequency is q2=0.09, not q=0.09.
- q=0.30, so p=0.70.
- Compute 2pq=2(0.70)(0.30).
0.42, or 42%. The inference depends on the simple dominance and equilibrium assumptions.
Count alleles rather than guessing from phenotypes
A sample contains 36 AA, 48 Aa and 16 aa individuals. Calculate p and q.
Reveal worked solution
- There are 200 allele copies in 100 diploid individuals.
- A copies: 2(36)+48=120; therefore p==0.60.
- a copies: 2(16)+48=80; therefore q=0.40.
- Expected equilibrium proportions at these allele frequencies are 0.36, 0.48 and 0.16.
The sample matches these expectations, but agreement alone does not prove every equilibrium assumption holds.
MAKE THE DISTINCTION
Common mistakes, clearer reasoning
The trapThe environment creates mutations because organisms need them.
The better explanationVariation arises without anticipation; selection changes the representation of heritable variants.
The trapA tree’s nearest-looking tips must be closest relatives.
The better explanationTrace the most recent common ancestor, regardless of the drawing’s orientation.
RETRIEVE BEFORE YOU REVEAL
Practice checkpoints
Revisit the quick checks from this guide without looking back. Explain why, then reveal the answer.
1. Can selection occur without producing evolution at a particular locus?
Reveal answer
Differential survival alone need not change allele frequencies if the relevant variation is not heritable or reproductive contributions do not differ.
2. Why is drift stronger in a small population?
Reveal answer
Each sampled reproductive event represents a larger fraction of the gene pool, increasing random proportional changes.
3. What evidence would support a prezygotic barrier?
Reveal answer
A difference such as mating time, behavior, or gamete compatibility that prevents fertilization between populations.
4. Why might an advantageous allele disappear from a very small population?
Reveal answer
Random sampling through drift can remove an allele despite its potential selective advantage.
5. Does rotating branches around a phylogenetic node change which organisms share the most recent ancestor?
Reveal answer
No. The branching connections remain the same.
6. After a random storm, a rare allele disappears from a small island population. Does disappearance establish that the allele was harmful?
Reveal answer
No. Random survival can remove an allele through drift. Evidence of heritable differences in reproductive success is needed to support a selective explanation.
Key language
- Fitness
- Relative contribution of viable offspring to later generations.
- Genetic drift
- Random changes in allele frequencies through sampling.
- Homology
- Similarity due to common ancestry.
- Clade
- An ancestor and all of its descendants.
- Genetic drift
- Random allele-frequency change caused by sampling across generations.
- Clade
- An ancestor and all of its descendants.
Heredity explains transmission; ecology supplies the environmental context in which relative fitness is measured.