
On this page0% through guide
Ecology
Track energy, matter, and interactions from individuals to ecosystems.
What you’ll learn
- Model population growth and identify limiting factors.
- Explain community change through interactions and disturbance.
- Interpret ecological evidence without confusing association and cause.
Before you begin
A population is one species in a defined area; a community includes multiple species; an ecosystem also includes the physical environment. A rate has a time dimension. A population of 1,000 organisms is not the same quantity as growth of 1,000 organisms per year.
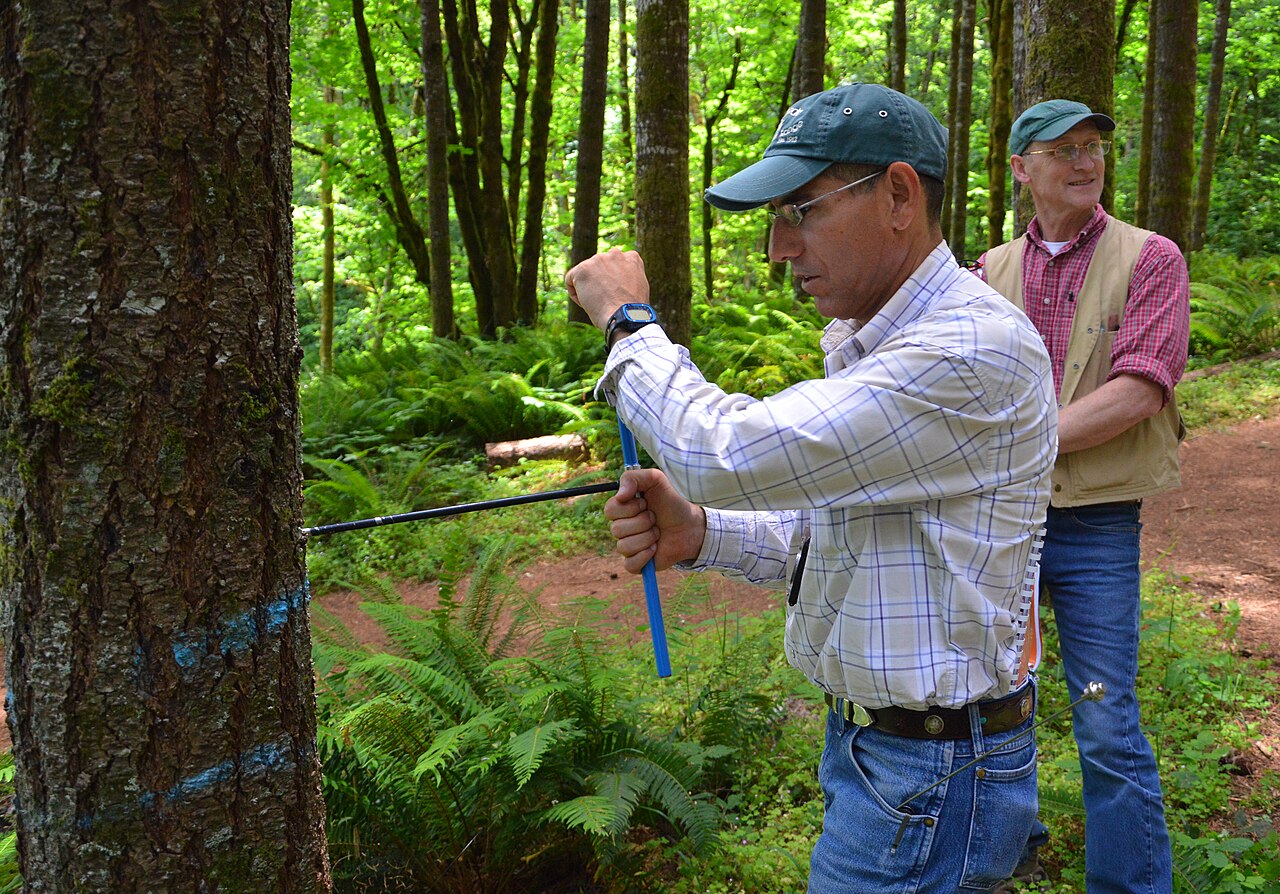
Field observations need a sampling frame, consistent measurements, and independent sampling units. Accessible locations alone can misrepresent the forest. This photograph illustrates fieldwork rather than supplying the numerical examples in this guide.
Photo: NRCS Oregon / USDA · Source · U.S. federal government public domain · Unmodified.Explain these starting ideas in your own words. Revisit them whenever a later step feels unclear.
Responses begin at the organism
Organisms detect and respond to environmental information. Behavioral and physiological responses can affect survival and reproduction; both inherited mechanisms and learning can contribute. An adaptive explanation must connect the response to reproductive consequences in a particular environment, not merely label the behavior “helpful.”
Ecological experiments need replication at the treatment level. If all treated organisms occupy one enclosure and all controls occupy another, enclosure effects can be confounded with treatment. Random assignment, independent replicate enclosures, and controlled measurement methods make causal claims stronger.
Population growth is a rate, not a head count
Population size changes through births, deaths, immigration, and emigration. Exponential growth assumes a constant per-capita growth rate without a resource limit. Logistic growth adds a carrying-capacity term, causing growth to slow as population size approaches K. Real populations may fluctuate, overshoot, or experience changing carrying capacities.
In the simple logistic model with positive r, total growth is greatest at N = . Per-capita growth, however, is greatest at low density. Density-dependent factors such as competition or some disease processes can intensify with density. A physical disturbance may act largely independently of density, although its consequences can interact with population conditions.
Read figure values as text
rN(1 − N/K): 0: 0; 100: 18; 250: 37.5; 500: 50; 750: 37.5; 900: 18; 1000: 0
PAUSE & TRY IT
Why can total logistic growth decline while population size is still increasing?
Reveal answer
For < N < K, the growth rate remains positive but the limiting term increasingly reduces its magnitude.
Energy flows; matter cycles
Producers convert external energy into chemical energy. Gross primary productivity is the total rate of energy capture; net primary productivity subtracts producer respiration and describes energy retained in new biomass. Consumers obtain only part of the energy available at the preceding trophic level because organisms respire, lose waste, and are not completely consumed.
A stated transfer efficiency is a model parameter, not a universal 10% law. Energy is ultimately dissipated as heat, whereas atoms can be recycled through biological and physical processes. Carbon moves through fixation, feeding, respiration, decomposition, and storage; nitrogen availability depends on transformations among chemical forms.
PAUSE & TRY IT
What distinguishes energy from carbon in an ecosystem budget?
Reveal answer
Energy flows and is dissipated as heat, while carbon atoms can cycle repeatedly among organisms and the environment.
Species interactions reshape communities
Competition can limit use of a shared resource. Predation, herbivory, parasitism, mutualism, and commensalism describe different interaction outcomes, but their strength can depend on conditions. Resource partitioning can reduce overlap between species’ realized resource use.
A keystone species has an effect disproportionate to its abundance. Removing a predator can alter herbivores and then producers through a trophic cascade. Do not assume all predators have identical effects: food-web structure, alternative prey, and indirect interactions matter. A well-supported explanation traces specific causal links and predicts measurable responses.
PAUSE & TRY IT
Why can removing a top predator reduce plant biomass?
Reveal answer
If herbivores increase when predation falls, greater herbivory can reduce plants; this prediction depends on the food web.
Diversity and disturbance operate at several scales
Diversity includes richness and relative abundance, as well as genetic and ecosystem variation. A community with many species but one overwhelming dominant species differs from an equally rich community with even abundances. Diversity may influence resilience and productivity, but the relationship must be evaluated in the system being studied.
Disturbance changes resources and community composition. Succession depends on surviving organisms, soil, dispersal, and environmental conditions; it is not always a fixed march toward one final community. Habitat fragmentation, invasive species, pollution, and climate change can interact, so a conservation proposal should identify the mechanism it addresses and a measurable criterion for success.
Turn a population model into a prediction
Exponential growth assumes a constant per-capita growth rate and produces a total growth rate proportional to population size. Logistic growth adds a limiting effect as population size approaches a carrying capacity. Carrying capacity is a feature of an environment at a time, not an immutable property of a species. Food availability, habitat change, disease, and climate can shift it.
For logistic growth, dN/dt=rN(1−). When N is small relative to K, the limiting factor is near one. At N=K, net growth is zero in the model. At N=, the total growth rate is largest for fixed positive r and K. This does not mean each individual grows fastest there: per-capita population growth decreases as N increases. Distinguish a graph of population size from a graph of growth rate.
Read figure values as text
Logistic growth: 0: 10; 0.20833333333333334: 11.60316858415918; 0.4166666666666667: 13.425014015704148; 0.625: 15.482809896025467; 0.8333333333333334: 17.791207146159685; 1.0416666666666667: 20.36086009834889; 1.25: 23.19693166840739; 1.4583333333333333: 26.29759558438421; 1.6666666666666667: 29.652699490970527; 1.875: 33.24278617431193; 2.0833333333333335: 37.03867736293215; 2.2916666666666665: 41.00179329403635; 2.5: 45.085306037928376; 2.7083333333333335: 49.236111674682; 2.9166666666666665: 53.39747549784423; 3.125: 57.51208513645147; 3.3333333333333335: 61.52516979202885; 3.5416666666666665: 65.3873310681198; 3.75: 69.05678577030156; 3.9583333333333335: 72.50082803935007; 4.166666666666667: 75.69644857433642; 4.375: 78.63017115706754; 4.583333333333333: 81.29725715476461; 4.791666666666667: 83.70047595188035; 5: 85.84864497582141; 5.208333333333333: 87.75511754514584; 5.416666666666667: 89.43635396238913; 5.625: 90.91066375909784; 5.833333333333333: 92.1971638260238; 6.041666666666667: 93.31496319454575; 6.25: 94.28256185740149; 6.458333333333333: 95.11743732106943; 6.666666666666667: 95.83578653490957; 6.875: 96.45239014119437; 7.083333333333333: 96.98056857106995; 7.291666666666667: 97.43220376699286; 7.5: 97.8178051236962; 7.708333333333333: 98.14660291090243; 7.916666666666667: 98.42665659602517; 8.125: 98.66496896811478; 8.333333333333334: 98.86759975623592; 8.541666666666666: 99.03977459286625; 8.75: 99.18598678672114; 8.958333333333334: 99.31009053954303; 9.166666666666666: 99.41538506252249; 9.375: 99.50468960281843; 9.583333333333334: 99.58040974757542; 9.791666666666666: 99.64459558643836; 10: 99.69899242601383
PAUSE & TRY IT
Why does removing a predator not always produce the same ecosystem response?
Reveal answer
The response depends on food-web connections, alternative resources, competing species, and compensating changes.
Explain a trophic cascade through intermediate steps
Removing a predator may allow some prey populations to increase, increasing pressure on producers. But real food webs contain alternative prey, competition, and compensating responses. Predict the direction of each direct interaction before combining them into an indirect effect. A negative effect on an herbivore can produce a positive indirect effect on a plant, but only under the stated food-web relationships.
Energy enters most ecosystems through photosynthesis and leaves as heat through metabolic processes. Biomass production available to the next trophic level is a fraction of production below it; transfer efficiency varies rather than always equaling exactly 10%. Matter cycles among organisms and reservoirs. A decrease in available energy across trophic levels does not mean that atoms disappear. Keystone species have effects disproportionate to their abundance, while dominant species can matter because they are abundant.
PAUSE & TRY IT
What happens to a mark–recapture estimate if marked organisms become harder to recapture?
Reveal answer
The marked fraction in the second sample is smaller, which tends to inflate the estimated population.
Design an ecological investigation with an honest conclusion
Use quadrats for organisms suited to fixed-area sampling and transects to study change across a spatial gradient. Random placement helps avoid choosing only convenient or unusually dense patches. Replicate at the level of the treatment: ten leaves from one treated plant do not necessarily provide ten independent treatment replicates. Control plots and measurements before and after treatment can strengthen interpretation.
For mark–recapture, a simple estimate assumes marks persist, marked organisms mix, capture probability is comparable, and the population is approximately closed during sampling. If marked individuals avoid traps, the recaptured marked fraction decreases and the estimated population can be inflated. For diversity comparisons, consider both richness and evenness. A community with many species but one overwhelmingly dominant species differs from one with similar abundance across species.
Connect organismal responses to population outcomes
An organism responds to information in its environment through physiological or behavioral mechanisms. A cue can change feeding, movement or reproduction. To explain an ecological consequence, connect that response to survival or reproductive success and then to population change. A behavior described as “good for the species” is not a sufficient mechanism; identify effects on individuals and transmission of heritable traits where relevant.
Population size changes through births, deaths, immigration and emigration. Distinguish a count from a rate and a total rate from a per-capita rate. A large population may add many individuals even if its growth per individual is low. An age distribution with many young individuals can produce future growth even after fertility declines, because a large cohort is entering reproductive ages.
For exponential growth, a constant per-capita rate yields a total rate proportional to N. Logistic growth adds a density-dependent reduction involving K. Carrying capacity summarizes conditions, not a permanently fixed species property. Food, disease, habitat or climate can change it. A smooth model is an idealization of populations that may fluctuate, overshoot or experience delayed responses.
PAUSE & TRY IT
A population grows from 400 to 440 in one year. What are its total and relative changes?
Reveal answer
The total change is 40 individuals. Relative to the initial population, the change is =0.10, or 10% over that year. This finite-interval calculation is not automatically the instantaneous logistic parameter r.
Explain food webs using energy and matter separately
Producers transform available energy into stored chemical energy; consumers acquire organic matter by feeding. Gross primary production includes total fixation, while net primary production subtracts producer respiration. Energy is transferred and transformed, with some becoming less available for biological work as heat. Matter moves among organisms and environmental reservoirs and can be reused.
Transfer efficiency is a ratio for a specified transfer, not a universal exact 10%. Distinguish ingestion, assimilation and incorporation into new biomass. Unconsumed material and waste can enter detrital pathways. A food web captures organisms feeding at more than one trophic level and the role of decomposers more accurately than a single chain.
To explain a trophic cascade, include the intermediate population and interaction. Predator removal can raise herbivore abundance, increasing grazing and lowering plant biomass. The sign of the indirect effect follows the links, but real responses depend on alternative prey, nutrients and other interactions. Data on the intermediate process strengthen a causal explanation.
Compare communities without confusing the levels of biodiversity
Species richness counts species; community diversity also reflects how evenly individuals are distributed. Two communities can have the same richness but different dominance patterns. Genetic diversity concerns variation within populations and can affect their capacity to respond to change. Ecosystem diversity concerns different habitats and processes across a landscape. Specify the scale instead of treating all biodiversity measures as interchangeable.
Competition can occur within or between species for a limiting resource. Resource partitioning can reduce overlap. Mutualism benefits both partners under the stated conditions, whereas predation, herbivory and parasitism impose different costs on the consumed or exploited organism. A species’ effect on community structure need not be proportional to its abundance.
Disturbance changes resources and survival conditions. Primary succession begins where developed soil is absent; secondary succession proceeds where soil or biological remnants persist. Recovery is influenced by dispersal, seed banks, soil, climate and later disturbances, not by a guaranteed march toward one unchanging final community. Describe resistance to disturbance separately from recovery afterward.
Design an ecological test that supports its conclusion
Identify the independent experimental unit. If fertilizer is applied to one pond and twenty water samples are taken, the samples are subsamples of one treated pond, not twenty independently treated replicates. Replicate treatment across independent units when possible and use comparable untreated controls. Random assignment helps separate treatment from preexisting differences.
A before-and-after comparison can reveal change, but other events may also occur during the interval. A control measured over the same period helps estimate background change. Repeated measures improve information about a unit without creating new independent units. Keep sampling effort and measurement procedures comparable across treatments.
Graphs should identify the response variable, units, sample size and meaning of error bars. Overlap of unspecified error bars is not a universal significance test. Explain a trend using the measured quantities and report an appropriate numerical comparison. A correlation between nutrient concentration and algal biomass suggests a relationship; manipulation and control of alternatives provide stronger support for a causal nutrient effect.
FROM IDEA TO APPLICATION
Worked examples
Calculate growth and interpret it
A population has N = 200, K = 1,000, and r = 0.15 per year. Use the logistic model to estimate its instantaneous growth rate.
Reveal worked solution
- The limiting factor is 1 − ,000 = 0.8.
- Multiply: 0.15 × 200 × 0.8 = 24.
- Because this is a rate, include individuals per year; it is not automatically the exact population increase over a full year.
The instantaneous growth rate is 24 individuals per year under the model.
Trace two transfers
Producers retain 40,000 kJ. Primary consumers receive 12% of that energy, and secondary consumers receive 8% of the primary-consumer energy. Calculate the secondary-consumer energy.
Reveal worked solution
- Primary consumers receive 40,000 × 0.12 = 4,800 kJ.
- Secondary consumers receive 4,800 × 0.08 = 384 kJ.
- Apply each efficiency to the energy of the immediately preceding level.
384 kJ, or 0.96% of the producer energy.
A mark–recapture estimate with assumptions
Researchers mark 40 individuals, release them, and later capture 50 individuals, of which 10 are marked. Estimate population size.
Reveal worked solution
- Assume the marked fraction in the second sample approximates the marked fraction in the population.
- Set =.
- Solve N=.
Approximately 200 individuals, provided mixing, mark retention, comparable capture probability, and closure assumptions are reasonable.
A carrying-capacity calculation
For r=0.20 per year, K=1,000, and N=500, calculate the logistic population growth rate.
Reveal worked solution
- The limiting factor is 1−,000=0.5.
- Multiply rN by the limiting factor: 0.20×500×0.5.
- Include the population-per-time units.
50 individuals per year. The population size is 500; the growth rate is 50 per year.
Separate treatment replication from subsampling
Six stream channels are randomly assigned: three receive added nutrients and three are controls. Five water samples are taken in each channel. Identify the replicate count and a useful response.
Reveal worked solution
- The nutrient treatment is applied to channels, so each treatment has three independent experimental units.
- Five samples per channel characterize within-channel conditions; they do not make fifteen independent channels.
- Algal biomass change per area over a fixed interval is a possible response, provided measurements are comparable.
Analyze the treatment comparison at the channel level while using the subsamples to estimate each channel’s response.
MAKE THE DISTINCTION
Common mistakes, clearer reasoning
The trapCarrying capacity is a permanent species property.
The better explanationK describes an environment’s support under particular conditions and can change with resources and disturbance.
The trapA correlation between diversity and productivity proves diversity caused productivity.
The better explanationOther environmental variables may influence both; controlled manipulation or stronger design is needed for causal inference.
RETRIEVE BEFORE YOU REVEAL
Practice checkpoints
Revisit the quick checks from this guide without looking back. Explain why, then reveal the answer.
1. Why can total logistic growth decline while population size is still increasing?
Reveal answer
For < N < K, the growth rate remains positive but the limiting term increasingly reduces its magnitude.
2. Why can removing a top predator reduce plant biomass?
Reveal answer
If herbivores increase when predation falls, greater herbivory can reduce plants; this prediction depends on the food web.
3. What distinguishes energy from carbon in an ecosystem budget?
Reveal answer
Energy flows and is dissipated as heat, while carbon atoms can cycle repeatedly among organisms and the environment.
4. Why does removing a predator not always produce the same ecosystem response?
Reveal answer
The response depends on food-web connections, alternative resources, competing species, and compensating changes.
5. What happens to a mark–recapture estimate if marked organisms become harder to recapture?
Reveal answer
The marked fraction in the second sample is smaller, which tends to inflate the estimated population.
6. A population grows from 400 to 440 in one year. What are its total and relative changes?
Reveal answer
The total change is 40 individuals. Relative to the initial population, the change is =0.10, or 10% over that year. This finite-interval calculation is not automatically the instantaneous logistic parameter r.
Key language
- Carrying capacity
- The population size supportable under particular environmental conditions.
- Net primary productivity
- Energy retained by producers after subtracting their respiration.
- Trophic cascade
- An indirect effect propagated across feeding relationships.
- Resilience
- The ability of a system to recover following disturbance.
- Trophic cascade
- An indirect effect transmitted across trophic interactions.
- Evenness
- How similarly individuals are distributed among species.
Ecology combines molecular energy transformations, heritable variation, and feedback at larger organizational scales.