
On this page0% through guide
Kinematics
Describe motion precisely before trying to explain its cause.
What you’ll learn
- Translate among motion descriptions, graphs, and equations.
- Separate vector components and interpret signs.
- Use constant-acceleration models only when justified.
Before you begin
A scalar has magnitude; a vector also has direction. Choose coordinate directions before assigning signs. A graph’s horizontal axis represents the independent variable, not necessarily horizontal position in physical space.
Explain these starting ideas in your own words. Revisit them whenever a later step feels unclear.
Choose a reference frame and a direction
Position is measured relative to a chosen origin. Displacement is final position minus initial position, while distance is total path length. A round trip can have zero displacement and nonzero distance. Velocity includes direction; speed is its magnitude. State a positive direction before assigning signs.
Average velocity is displacement divided by elapsed time. Instantaneous velocity describes a particular moment and is the slope of the position–time graph there. Average speed uses total distance instead, so it does not generally equal the magnitude of average velocity.
PAUSE & TRY IT
Can average velocity be zero while average speed is positive?
Reveal answer
Yes, for a nontrivial trip returning to its starting point.
Graph slopes and areas have physical meanings
Slope on a position–time graph represents velocity. Slope on a velocity–time graph represents acceleration. Signed area under a velocity–time graph represents displacement, while area under a speed–time graph represents distance. A graph’s vertical height is not interchangeable with its slope.
A negative velocity means motion in the negative direction, not necessarily slowing down. Speed increases when velocity and acceleration have the same sign and decreases when they have opposite signs. At a turnaround, velocity can be zero while acceleration is nonzero.
Read figure values as text
Velocity: 0: 4; 1: 2; 2: 0; 3: -2; 4: -4
PAUSE & TRY IT
What does a curved position–time graph imply?
Reveal answer
Its slope changes, so velocity changes over time.
Constant acceleration is an assumption
The familiar kinematic equations follow when acceleration remains constant during the interval. They connect initial and final velocity, displacement, and time. If acceleration changes, apply them separately only to intervals where the constant-acceleration approximation is valid or use graph-based reasoning.
Before calculating, list known quantities with signs and units, identify the requested quantity, and choose an equation that avoids unnecessary unknowns. A numerical answer should be checked against the physical description: a negative time may be a mathematically valid root outside the modeled interval.
PAUSE & TRY IT
Which assumption permits v2 = v02 + 2aΔx?
Reveal answer
Acceleration is constant over the modeled interval.
Two-dimensional motion has simultaneous components
Horizontal and vertical components share the same elapsed time but can have different accelerations. For ideal projectile motion near Earth with negligible air resistance, horizontal acceleration is zero and vertical acceleration is downward with magnitude g. Gravity acts during the entire flight, including at the highest point.
At the top of a nonvertical projectile path, the vertical velocity is zero but horizontal velocity remains. Equal-height launch and landing permit certain symmetries; unequal heights do not. Resolve the initial velocity into components before using one-dimensional equations.
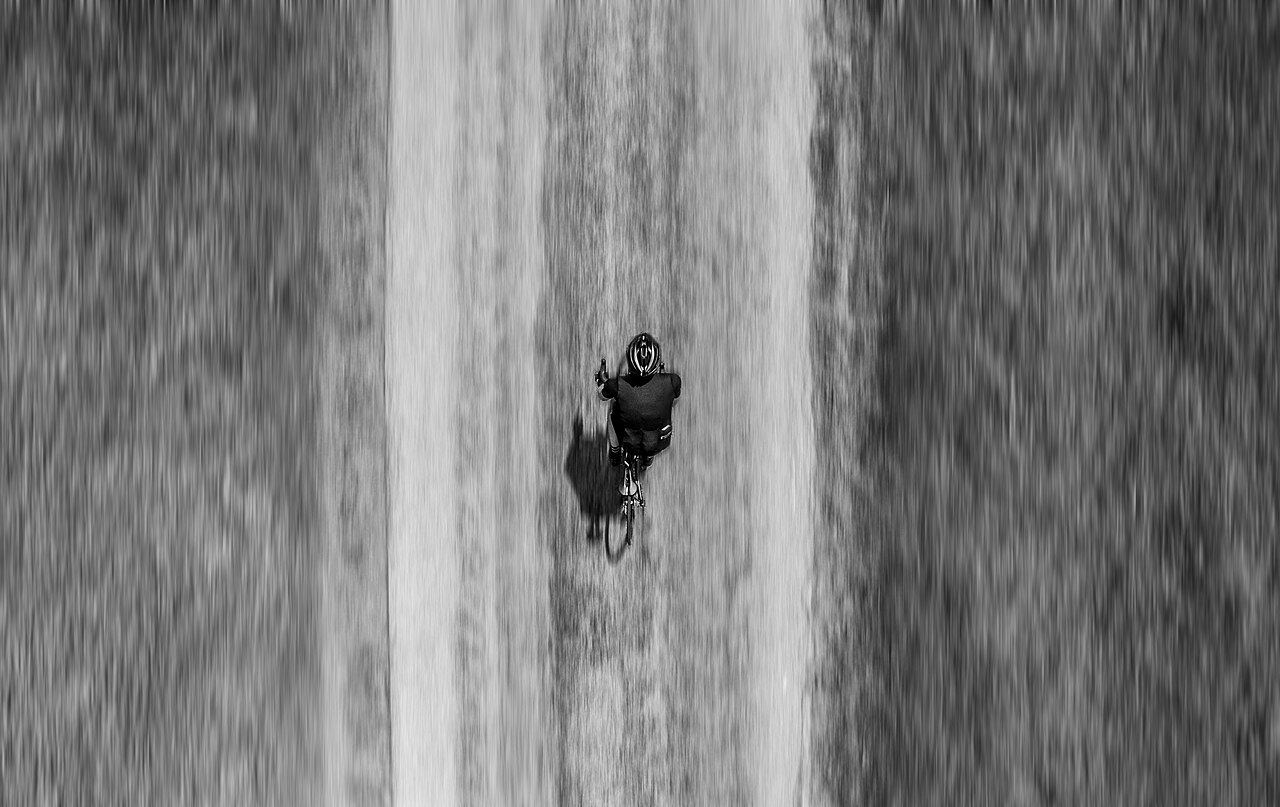
Choose a system boundary before applying force or energy reasoning. A photograph captures one instant; it cannot by itself determine velocity, acceleration, or net force.
Photo: Clemenspool · Source · CC0 1.0 · Unmodified.Read figure values as text
v=4−2t: 0: 4; 0.0625: 3.875; 0.125: 3.75; 0.1875: 3.625; 0.25: 3.5; 0.3125: 3.375; 0.375: 3.25; 0.4375: 3.125; 0.5: 3; 0.5625: 2.875; 0.625: 2.75; 0.6875: 2.625; 0.75: 2.5; 0.8125: 2.375; 0.875: 2.25; 0.9375: 2.125; 1: 2; 1.0625: 1.875; 1.125: 1.75; 1.1875: 1.625; 1.25: 1.5; 1.3125: 1.375; 1.375: 1.25; 1.4375: 1.125; 1.5: 1; 1.5625: 0.875; 1.625: 0.75; 1.6875: 0.625; 1.75: 0.5; 1.8125: 0.375; 1.875: 0.25; 1.9375: 0.125; 2: 0; 2.0625: -0.125; 2.125: -0.25; 2.1875: -0.375; 2.25: -0.5; 2.3125: -0.625; 2.375: -0.75; 2.4375: -0.875; 2.5: -1; 2.5625: -1.125; 2.625: -1.25; 2.6875: -1.375; 2.75: -1.5; 2.8125: -1.625; 2.875: -1.75; 2.9375: -1.875; 3: -2
Measurements test a motion model
A motion detector or video provides position measurements at successive times. Estimating slopes over intervals gives average velocities; shorter intervals can approximate instantaneous values but may amplify measurement noise. A best-fit model uses the whole data pattern rather than one convenient point.
Repeat measurements, state uncertainty, and identify systematic effects such as camera perspective or a tilted track. A graph that is nearly linear can support a constant-velocity model over the tested interval; it does not prove motion remains constant forever.
Build a motion story from three representations
A position–time graph tells where the object is; its slope tells velocity. A velocity–time graph tells the signed rate of position change; its slope tells acceleration and its signed area tells displacement. An acceleration–time graph tells how velocity changes; its signed area gives the velocity change. Identify the axes before interpreting a high point or a crossing.
An object can be far from the origin and momentarily at rest, producing a nonzero position with zero slope on the position graph. It can pass the origin at high speed, producing zero position with a steep slope. On a velocity graph, crossing the time axis indicates a possible reversal, while a horizontal nonzero line indicates constant velocity. These different meanings cannot be transferred from one graph type to another.
PAUSE & TRY IT
What does the slope of a displacement-versus-time-squared graph equal for motion from rest with constant acceleration?
Reveal answer
, because displacement=()at2.
Solve a multistage motion problem with shared boundaries
Divide the motion into intervals where a chosen model applies. For constant-acceleration intervals, use signed initial velocity, acceleration, time, and displacement. The final velocity and position from one interval become the initial conditions for the next. An object does not restart from rest just because your calculation starts a new stage.
For a braking car, a negative acceleration can be consistent with positive velocity until the stopping time. Continuing the same equation beyond that time predicts reversal, which may not match a real brake-controlled car. Interpret the mathematical domain physically. In projectile motion, use the same flight time in horizontal and vertical equations and avoid applying equal-height symmetry when launch and landing heights differ.
PAUSE & TRY IT
Why can extending a braking equation beyond the stopping time be physically inappropriate?
Reveal answer
The constant acceleration model would predict reversal, while the actual braking behavior may change when the car stops.
Use experimental graphs to extract a parameter
A graph of velocity against time can estimate constant acceleration from a best-fit slope. A graph of displacement against time squared can be linear when initial velocity is zero and acceleration is constant; its slope is , not a. Write the model in the form y=mx+b before interpreting the slope.
Include units in the slope calculation and distinguish systematic errors from random scatter. A timing offset can alter an intercept or distort a transformed graph. Repeated trials help estimate variability, while calibration helps address systematic measurement error. A good experimental conclusion states the tested range and the evidence supporting the model rather than claiming all motion follows the fitted line.
Make position, displacement, velocity and speed tell one story
Choose an origin and positive direction before inserting signs. Position locates an object relative to that origin; displacement subtracts initial position from final position. Distance adds the lengths of all path segments. An object can travel a substantial distance and have zero displacement if it returns to its starting point. Average velocity uses displacement over elapsed time, while average speed uses total distance.
Velocity’s sign describes direction in the chosen coordinate system. Acceleration describes how velocity changes, so negative acceleration is not automatically slowing down. If velocity and acceleration have opposite signs, speed decreases; if their signs agree, speed increases. At a turning point, velocity can be zero while acceleration is nonzero. The object’s instant of rest does not imply an absence of forces.
A complete description connects signs, graph shape and motion. A position graph rising with decreasing slope means positive velocity with decreasing speed. The graph is not a picture of the physical path. Its vertical coordinate is position and its slope is velocity.
PAUSE & TRY IT
Can average velocity be zero while average speed is positive?
Reveal answer
Yes. A return trip has zero net displacement but positive total distance over the interval.
Translate graphs using slopes and signed areas
A secant slope on a position–time graph gives average velocity; a tangent gives instantaneous velocity. The slope of velocity versus time is acceleration. Signed area under velocity gives displacement, so portions below the time axis subtract. To find distance, add the magnitudes of the areas or integrate speed. Area under acceleration gives change in velocity, which must be combined with the initial velocity.
For constant acceleration, the velocity graph is a straight line and its area can be evaluated geometrically. The familiar kinematic equations are consequences of this special case. They are not universally valid when acceleration varies. A graph with several constant-acceleration intervals should be handled interval by interval, carrying the final state of one into the next.
When experimental points scatter, use an appropriate best-fit trend rather than connecting every fluctuation as exact motion. A slope has units obtained by dividing the vertical-axis units by the horizontal-axis units. An area has their product. These checks often reveal that a calculation answered the wrong physical question.
Separate the components of two-dimensional motion
Resolve the initial velocity into perpendicular components. In an ideal projectile model without air resistance, horizontal acceleration is zero and vertical acceleration is downward. The same elapsed time links the two component equations. The horizontal and vertical motions do not require separate clocks.
At the highest point, vertical velocity is zero but horizontal velocity can remain nonzero. The acceleration is still downward. Equal-height launch and landing can create useful symmetries, but an elevated landing or launch breaks the familiar equal-time or range shortcuts. Use the stated geometry rather than automatically assuming a symmetric arc.
Check limiting cases. A larger horizontal speed at the same height and vertical launch component changes horizontal distance but not the ideal flight time. A longer fall from rest takes more time because acceleration acts throughout, not because the object instantly moves at its final speed.
Choose a motion model from the information actually given
Constant-acceleration equations connect initial velocity, final velocity, displacement, acceleration, and time only when acceleration is constant over the interval. Write known quantities with signs, then choose an equation that avoids unnecessary unknowns. If acceleration varies, a graph or calculus method may be required instead.
For projectile motion without air resistance near Earth, horizontal and vertical components share the same elapsed time but have different accelerations. Horizontal acceleration is zero; vertical acceleration is approximately −g for an upward-positive axis. At the top of a trajectory, vertical velocity is zero while acceleration remains downward and horizontal velocity need not be zero.
A component equation cannot be filled with total speed unless that speed lies entirely along the component direction. Resolve an initial velocity using the stated angle and verify which axis the angle is measured from. A sketch with arrows is more reliable than choosing sine or cosine from memory.
PAUSE & TRY IT
At the top of projectile motion, which vertical quantity is zero?
Reveal answer
Vertical velocity is zero. Vertical acceleration remains approximately −g under the standard model.
Design and interpret a motion measurement
Position measurements at equal time intervals can estimate velocity from successive differences. A wider interval smooths local variation but gives an average over a longer time. Measurement uncertainty can become prominent when a small position difference is divided by a short time. Describe a trend rather than claiming every small fluctuation is physical.
A position-versus-time graph’s slope represents velocity, while a velocity-versus-time graph’s area represents displacement. Label axes before interpreting a shape. A straight line on a position graph means constant velocity; a straight sloped line on a velocity graph means constant acceleration.
For repeated trials, hold the intended controls fixed and report how the measured quantity is obtained. A camera angle can introduce perspective error; an uncertain starting frame affects timing. Repetition estimates variability but does not automatically remove a systematic calibration error.
FROM IDEA TO APPLICATION
Worked examples
Distance is not displacement
An object follows v = 4 − 2t in for 0 ≤ t ≤ 4 s. Find displacement and distance.
Reveal worked solution
- The positive triangular area from 0 to 2 s is ½(2)(4) = 4 m.
- The negative triangular area from 2 to 4 s is −4 m.
- Add signed areas for displacement and magnitudes for distance.
Displacement is 0 m; distance is 8 m.
A horizontal launch
A ball leaves a 5.0 m-high ledge horizontally at 3.0 . Neglect air resistance and use g = 10 . Find flight time and horizontal range.
Reveal worked solution
- Vertical drop: 5.0 = ½(10)t2, so t = 1.0 s.
- Horizontal displacement = 3.0 × 1.0.
Flight time is 1.0 s and range is 3.0 m.
Two stages of straight-line motion
A cart starts from rest, accelerates at 2.0 for 3.0 s, then moves at constant velocity for 4.0 s. Find total displacement.
Reveal worked solution
- First-stage final velocity is 0+2.0(3.0)=6.0 .
- First-stage displacement is ()(2.0)(3.0)2=9.0 m.
- Second-stage displacement is 6.0(4.0)=24 m.
- Add the displacements.
33 m in the positive direction.
Find displacement and distance from a changing velocity
A velocity graph falls linearly from +4 at t=0 to −2 at t=3 s. Find displacement and distance.
Reveal worked solution
- Acceleration is =−2 . Velocity crosses zero at 2 s.
- Positive area is ½(2)(4)=4 m. Negative area is −½(1)(2)=−1 m.
- Displacement is 4−1=3 m; distance is 4+1=5 m.
The object ends 3 m in the positive direction after traveling 5 m.
A projectile from a ledge
A ball leaves a 20 m ledge horizontally at 6 . Use g=10 and neglect drag.
Reveal worked solution
- Vertical motion gives −20=−()(10)t2, so t=2 s.
- Horizontal distance is 6(2)=12 m.
- Final vertical velocity is −20 while horizontal velocity remains 6 .
It lands 12 m horizontally from the launch point.
A graph slope
Position changes from 2 m to 14 m between 1 s and 4 s.
Reveal worked solution
- Displacement is 12 m and elapsed time is 3 s.
- Average velocity is .
4 ; this is not necessarily the instantaneous velocity at every time.
MAKE THE DISTINCTION
Common mistakes, clearer reasoning
The trapNegative acceleration means slowing down.
The better explanationCompare acceleration with velocity: the same sign increases speed.
The trapAcceleration is zero at the top of a projectile path.
The better explanationVertical velocity is zero there, but gravitational acceleration remains downward.
RETRIEVE BEFORE YOU REVEAL
Practice checkpoints
Revisit the quick checks from this guide without looking back. Explain why, then reveal the answer.
1. What does a curved position–time graph imply?
Reveal answer
Its slope changes, so velocity changes over time.
2. Can average velocity be zero while average speed is positive?
Reveal answer
Yes, for a nontrivial trip returning to its starting point.
3. Which assumption permits v2 = v02 + 2aΔx?
Reveal answer
Acceleration is constant over the modeled interval.
4. What does the slope of a displacement-versus-time-squared graph equal for motion from rest with constant acceleration?
Reveal answer
, because displacement=()at2.
5. Why can extending a braking equation beyond the stopping time be physically inappropriate?
Reveal answer
The constant acceleration model would predict reversal, while the actual braking behavior may change when the car stops.
6. Can average velocity be zero while average speed is positive?
Reveal answer
Yes. A return trip has zero net displacement but positive total distance over the interval.
7. At the top of projectile motion, which vertical quantity is zero?
Reveal answer
Vertical velocity is zero. Vertical acceleration remains approximately −g under the standard model.
Key language
- Displacement
- The vector change in position.
- Velocity
- The rate of change of position.
- Acceleration
- The rate of change of velocity.
- Projectile model
- Motion under gravity with other forces such as air resistance neglected.
Kinematics describes acceleration; forces in Unit 2 explain why it occurs.